Site Planning Tool
Example Case Study
This page provides a worked example, showing sample inputs to and results from the Site Planning tool for a depot. For more detailed step-by-step guidance see the user guide.
Assets - Inputs to the tool
Four types of ‘assets’ need to be specified to model a scenario - site, charge point type, electric vehicle type and schedule.
The Site
In this example we are creating a mid-sized depot with a 120kVA connection capacity . The depot’s current electricity use follows the Medium-sized site example and fluctuates between 30 and 90 kW throughout the day. The name and location are purely to help you identify the site. An electricity tariff of 18p/kWh has been entered.

For this site we have also entered entered a time of use (ToU) electricity tariff. This step is optional. A lower tariff of 10p/kWh applies from 0000 to 0600 on weekdays and at all times on weekends.
CAPEX and OPEX are also optional fields, and can be used to add site-level costs (such as investments in infrastructure to support electrification, or service costs such as maintenance. In this example there is a one-off cost of £5,000.

The Charge Points
A single type of charge point is being specified. It has one socket, and can charge at 7.4kW - the most popular speed for fast AC charging. Again, the name is for identification purposes only, and optional costs of £1500 (upfront cost for purchase and installation) and a monthly maintenance fee of £10 per charge point are specified.

The Vehicles and Schedules
The example van is based on the specification of one of the more capable electric vans currently available. It has a 75kWh battery and can travel 175 miles on one charge. It can charge using AC at 7.4kW. We have optionally added the purchase price of £33,000.

All of the vehicles operate the same schedule, the vehicles have left the site at 8am and return at 6pm, Monday to Friday. During the day they travel 75 miles. On Saturdays the vans each travel 30 miles between 0900 and 1400. No journeys are made on Sundays.

2. The Scenario
The simple scenario in this example involves the installation of 20 charge points at the site, coupled with 20 electric vehicles, each using the schedule that we specified. As we have specified a Time-of-Use tariff, we will use it in this scenario.

3. The Results
The following section presents the results from the scenario introduced above
Demand Profile
The Base Case demand for the site is 238kVA, calculated by adding the highest observed peak load from the site to the total possible demand from the charge points (20x7.4kW). This is almost twice the supply capacity (ASC) of 120kVA, so would require an upgrade.

The Unmanaged Charging scenario shown in the first graph takes into account when the vehicles would be expected to charge if they plugged in when they returned to the depot, and assumes they will charge at full rate. This results in a peak load of 223kVA (the dashed green line). This is slightly lower than the base scenario as the peak charging does not coincide with the peak background demand. This load is still substantially higher than the ASC (the dotted red line), so an upgrade would be required.
The Smart Charging scenario minimises the peak load of the site by spreading out the charging demand over the period when the vans are plugged in. Vans still charge as soon as they return to the depot, but the charge rate is reduced to take background load and time available to charge into account. In this example, spreading the load results in a peak load of 111kVA across the week (the green dashed line) this is below the supply capacity (the red dotted line) so could potentially be accommodated without reinforcement works if appropriate smart charging controls are put in place.

If an upgraded connection were needed, a profiled connection (where capacity varies by time of day), could be considered. For example in the above case more capacity might be available on the network overnight, but not during the daytime and this would fit with the operational times of the fleet. The timing of capacity constraints depends on other users of the network and varies by area. The downloadable file can be used to discuss options with your distribution network operator.
Costs
The costs page of the results provides a summary of the costs of implementing charging, based on the optional cost fields against each asset.

The Charging cost is based upon the time-of-use tariff. In the Unmanaged Charging scenario, most charging happens in the evening, when a higher cost applies, while in the Smart Charging scenario more charging happens in the cheaper early morning period, resulting in a cost reduction of £126 per week.
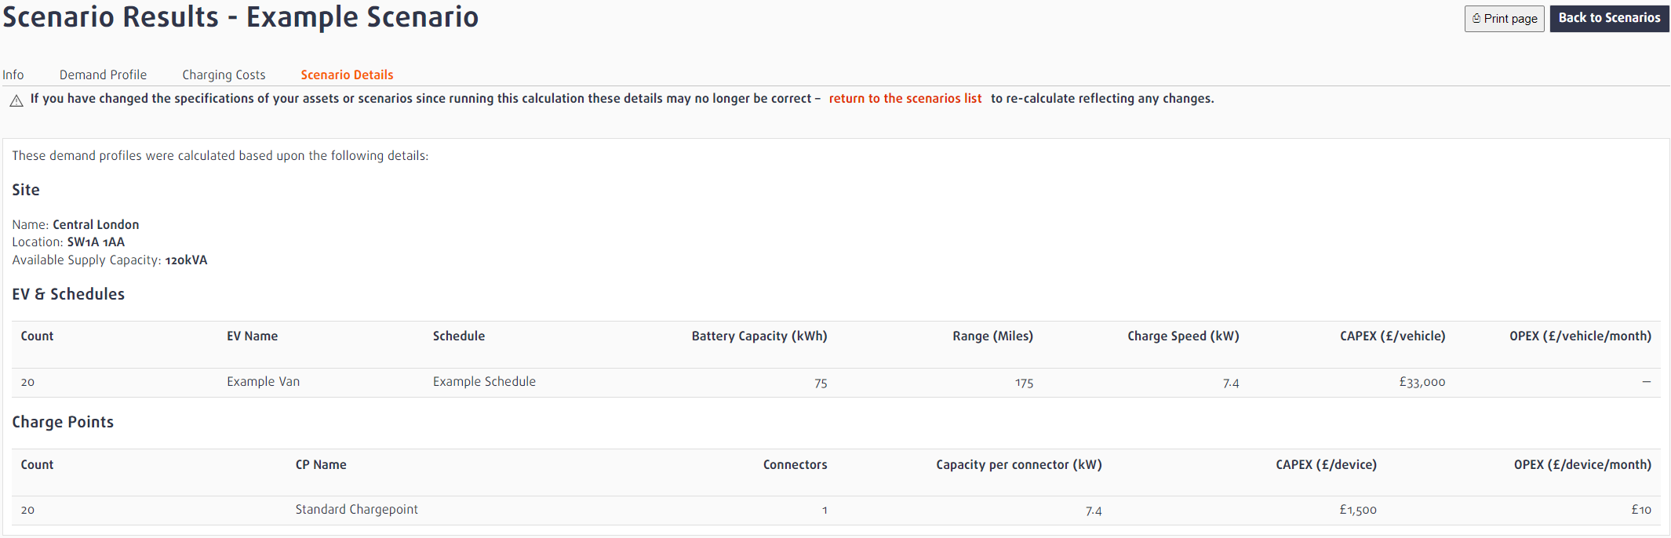
Scenario Details
The Scenario Details page of the results presents a summary of the assets used in the scenario and may be useful if you are creating multiple scenarios.